Original research · Data fetched 2 October 2026
The State of Podcasting 2026
How long top podcasts run, how often they publish, when they come out and how they title their episodes. We read the public RSS feeds of 881 shows in Apple Podcasts’ charts in six countries, 498,956 episodes in all, and counted.
Shorts by Slice: the typical top episode runs 42 minutes. Shorts finds the minute worth posting.Try it free →
The short answer
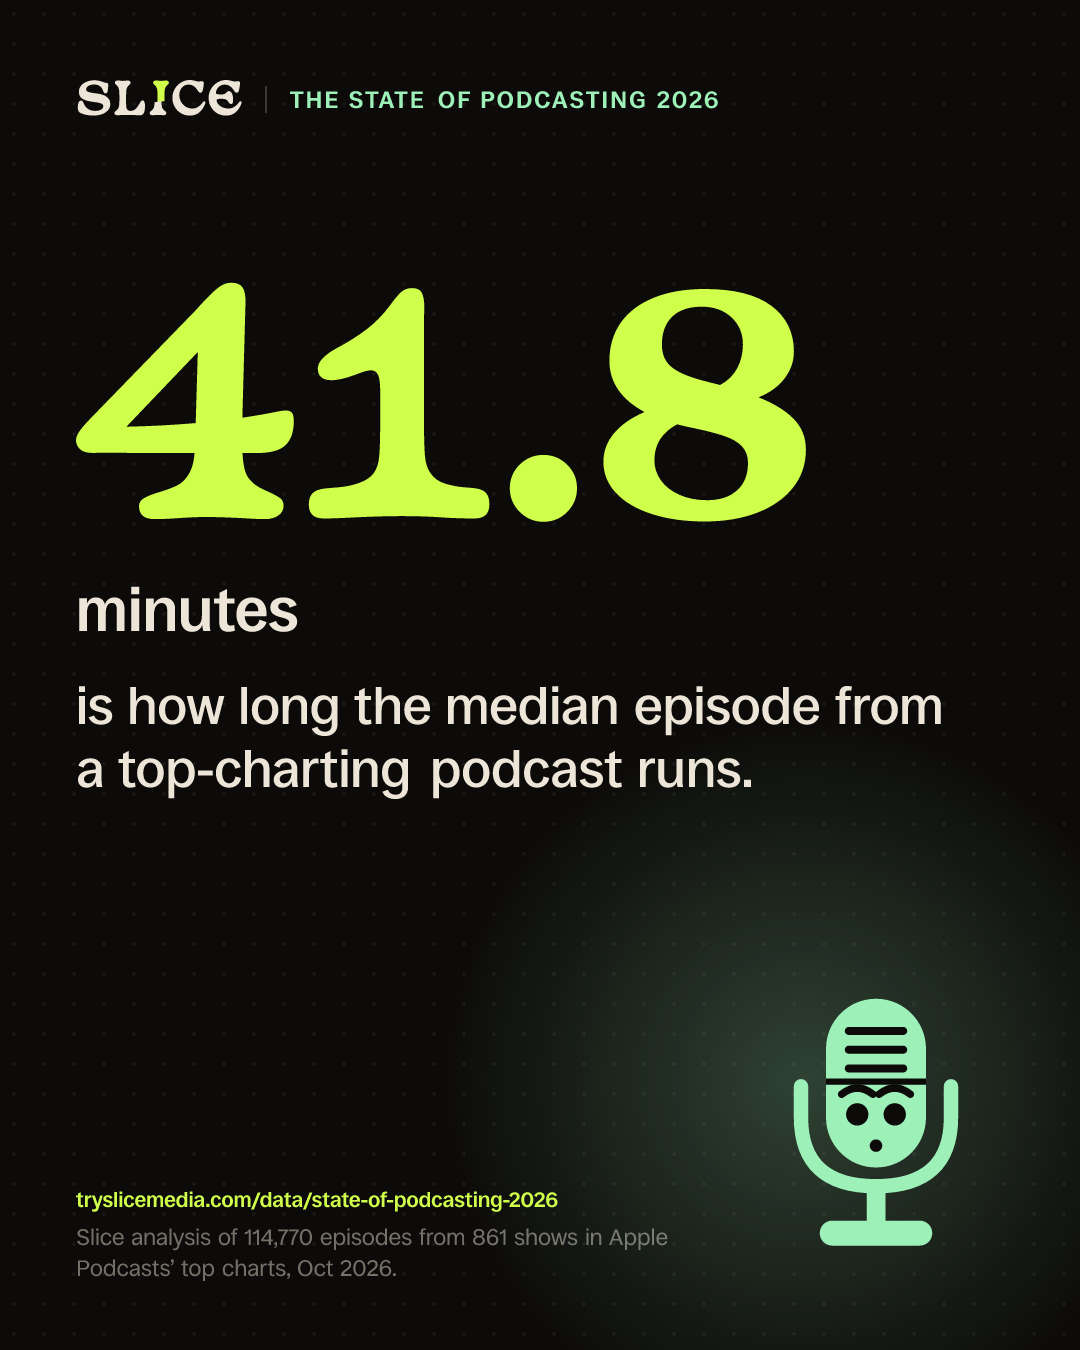
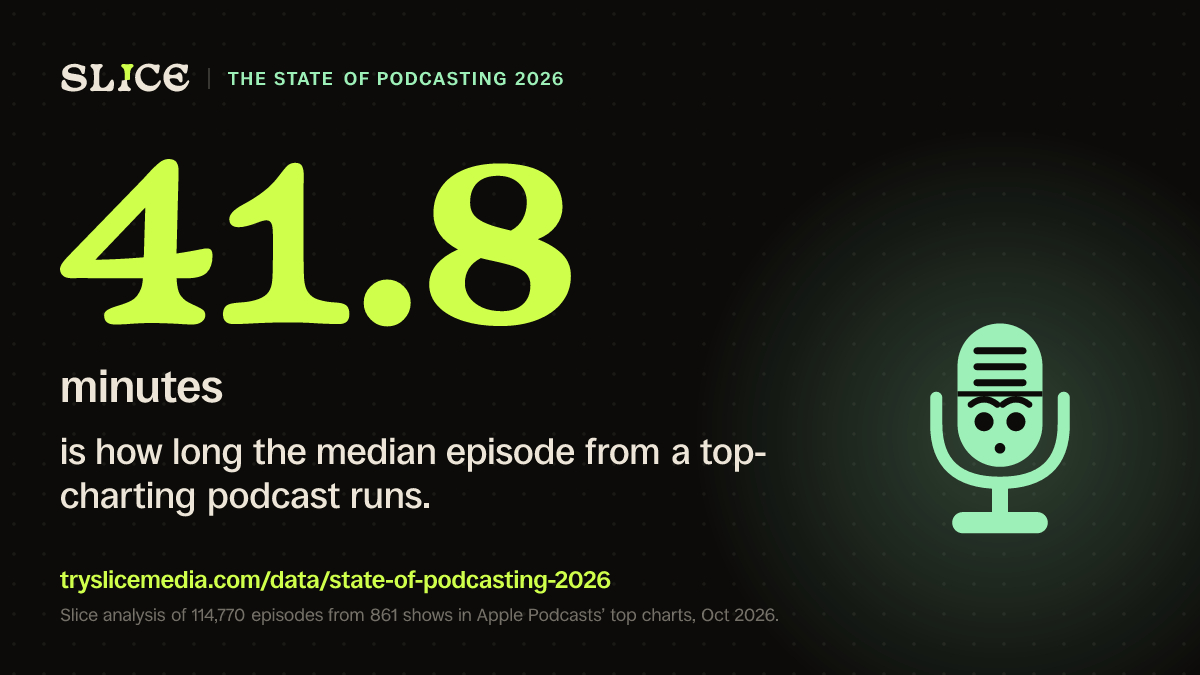
- The median episode from a top-charting podcast runs 41.8 minutes (n = 114,770 full episodes released in the 12 months to 2 October 2026, from 861 shows); the typical show's own median is 49.9 minutes.
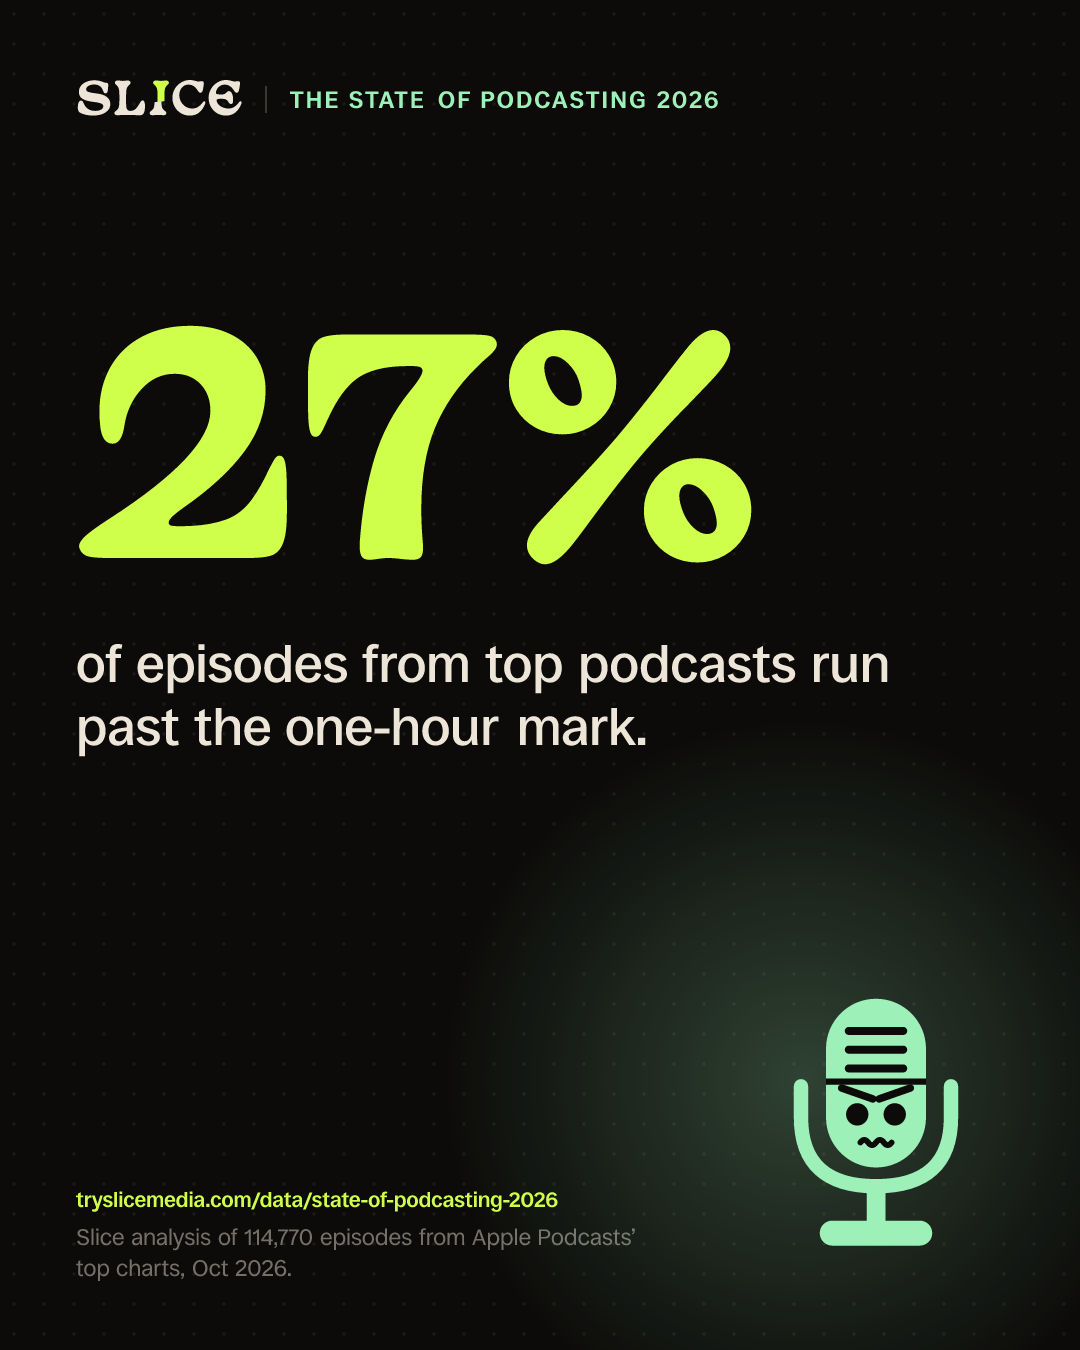
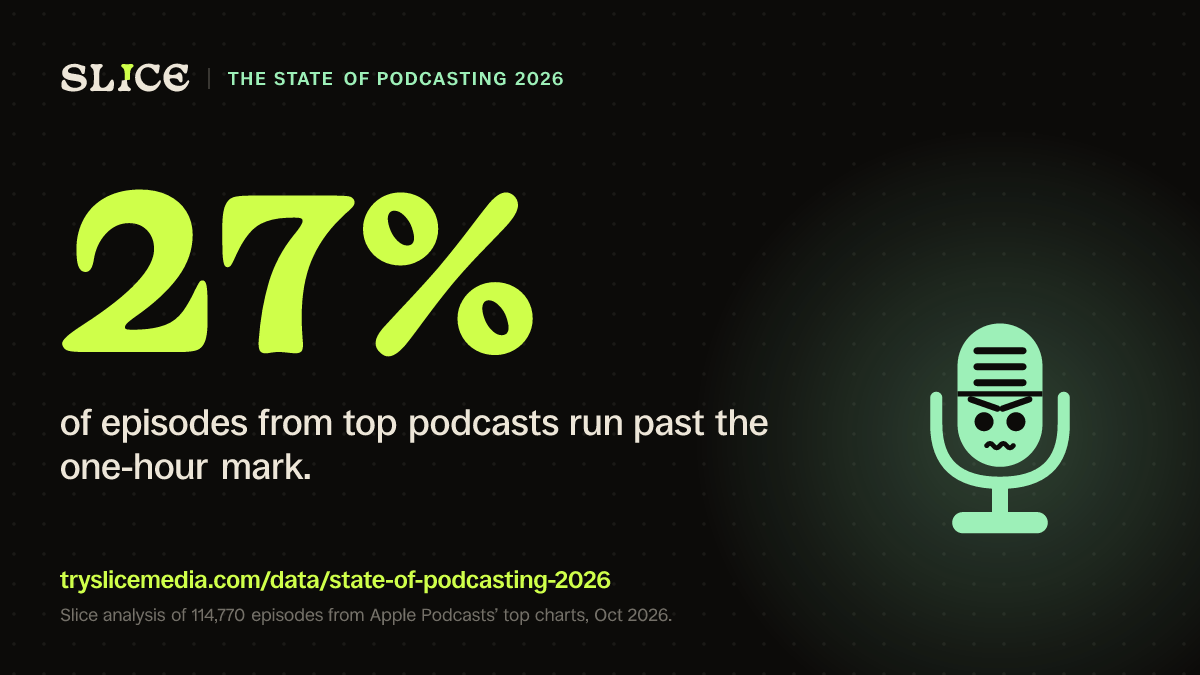
- 35% of those episodes are under 30 minutes, 38% run 30 to 60 minutes and 27% run over an hour (n = 114,770).
- Comedy has the longest episodes of the big categories, a typical show median of 66 minutes (86 shows), and News the shortest at 35 minutes (114 shows).
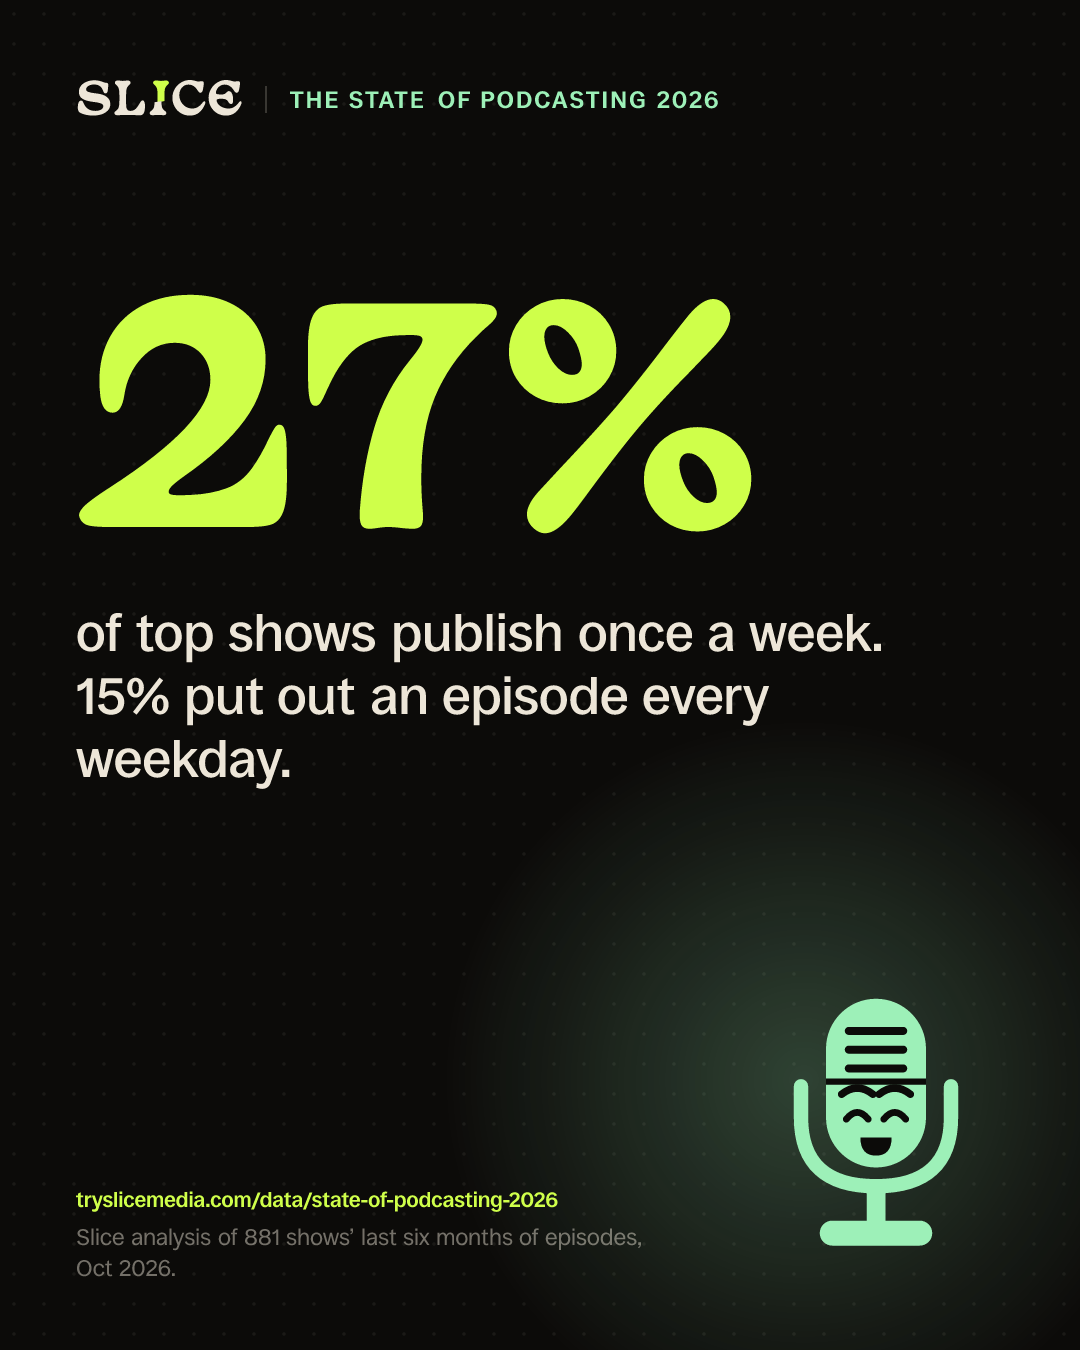
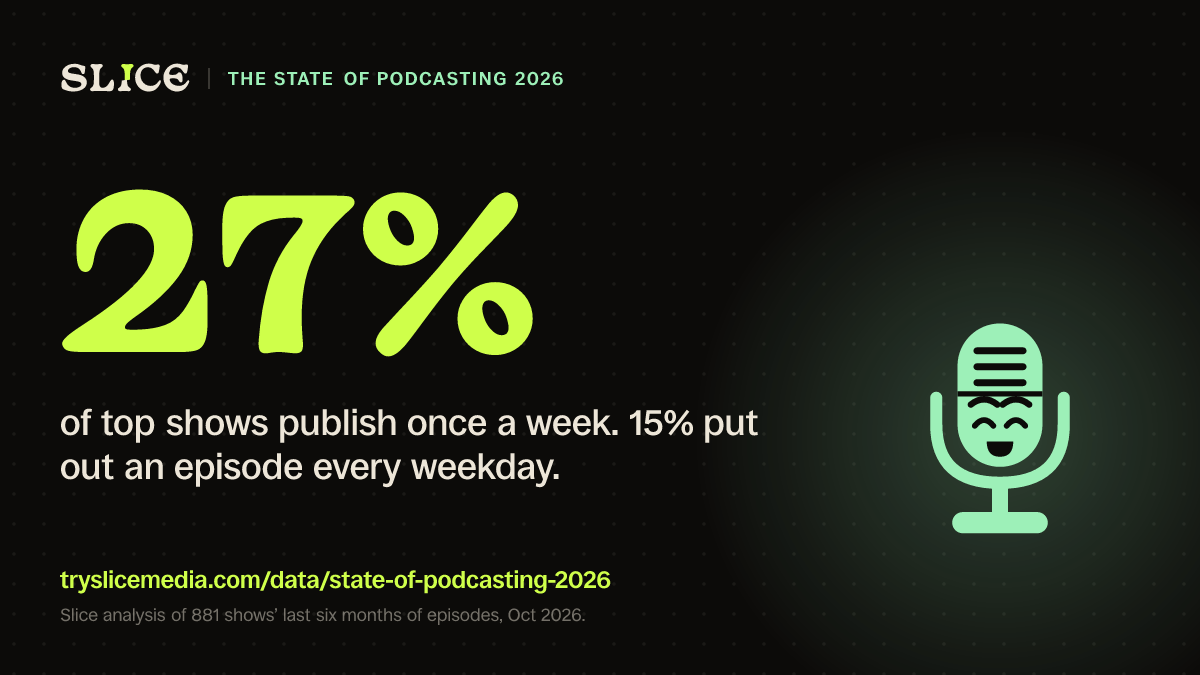
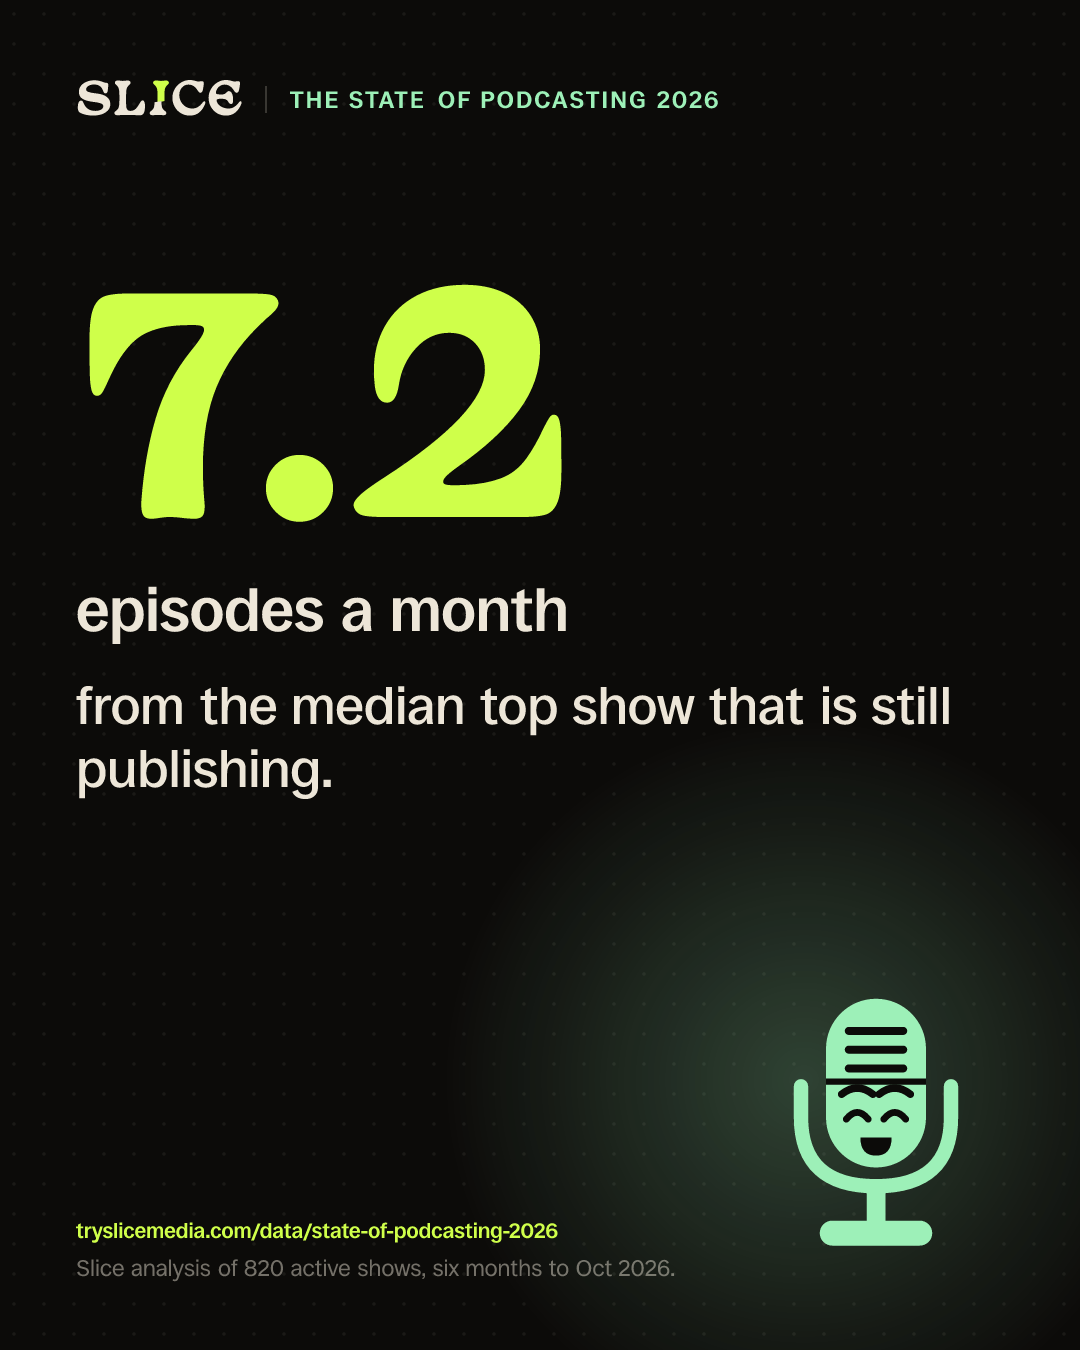
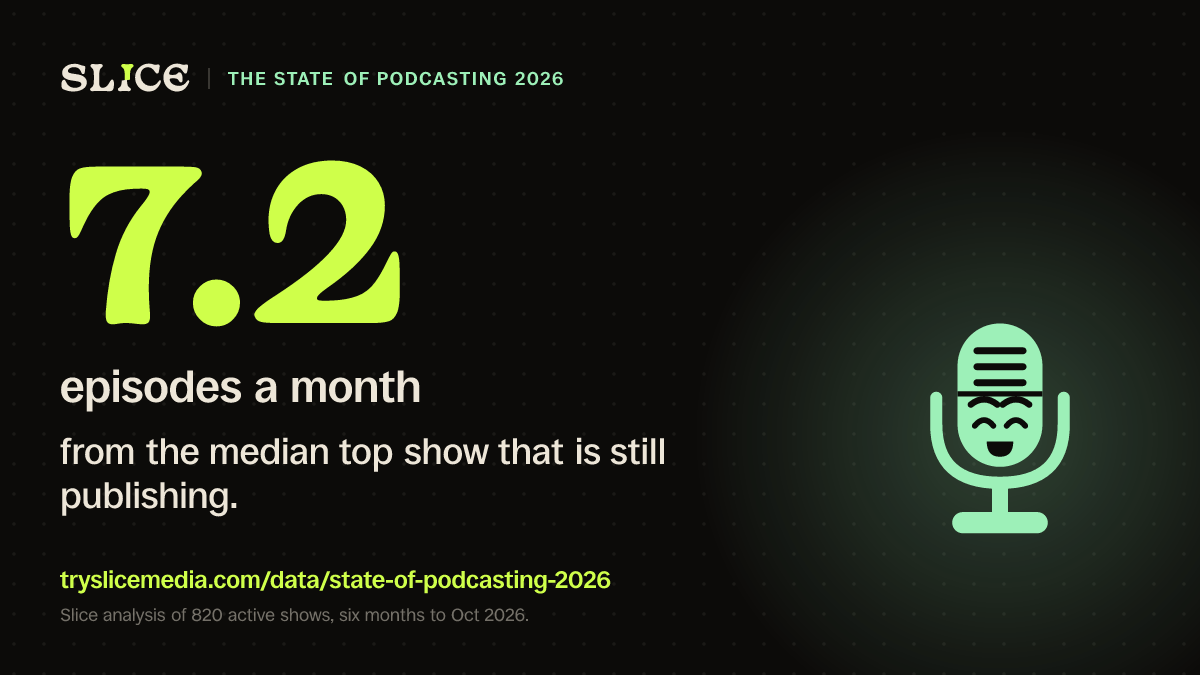
- Weekly is the most common schedule, at 27% of 881 shows; 15% publish daily, and the median active show puts out 7.2 episodes a month (820 shows, last six months).
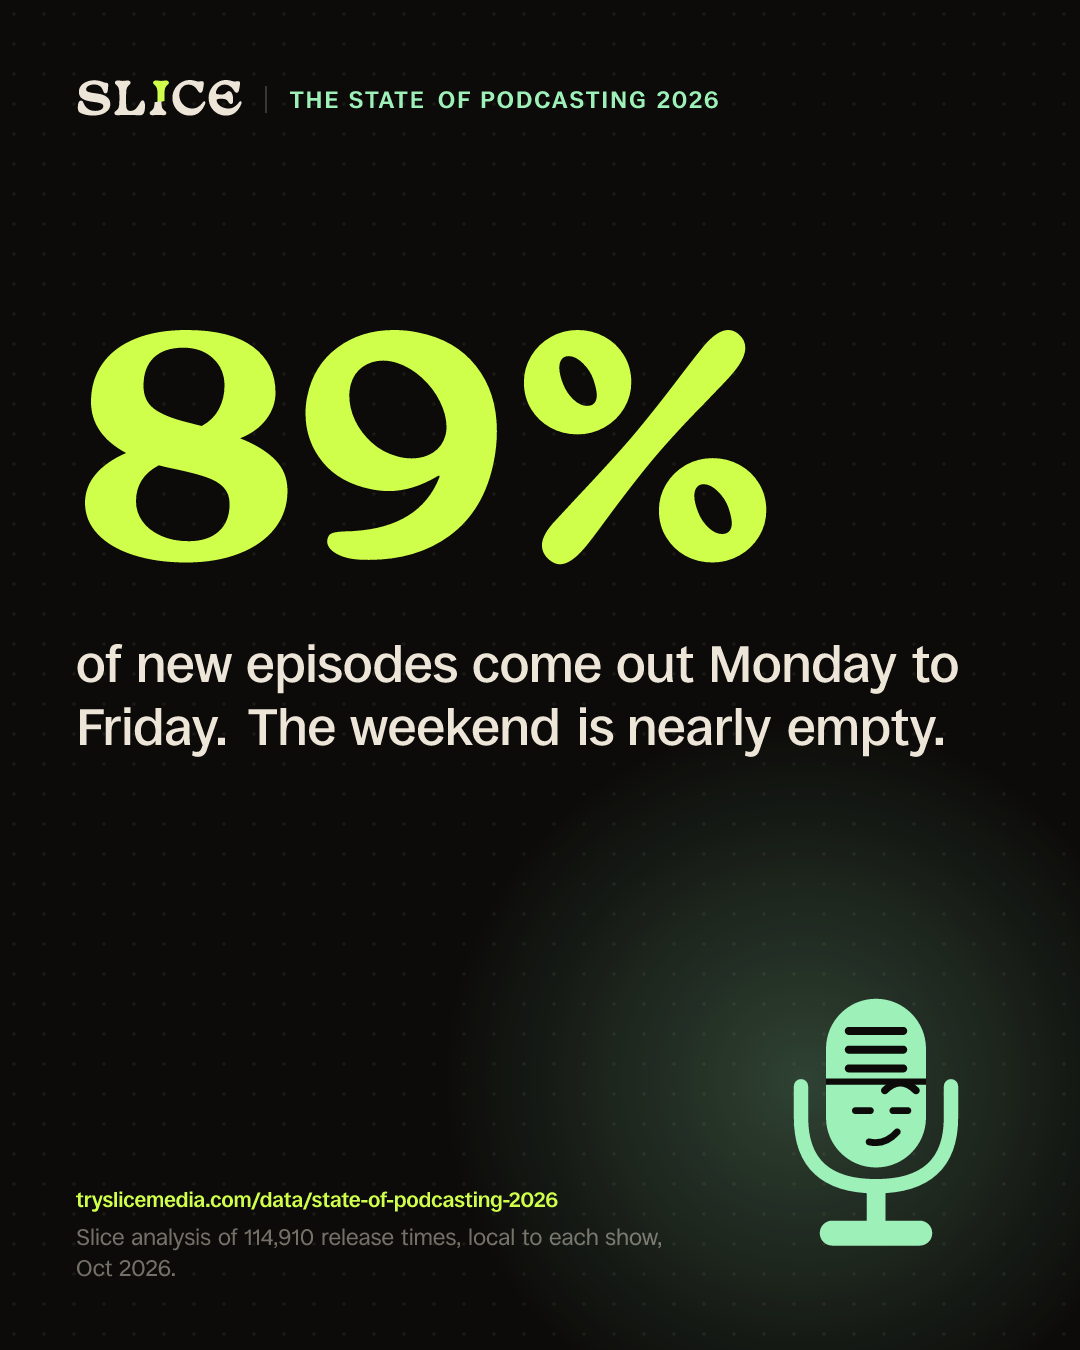
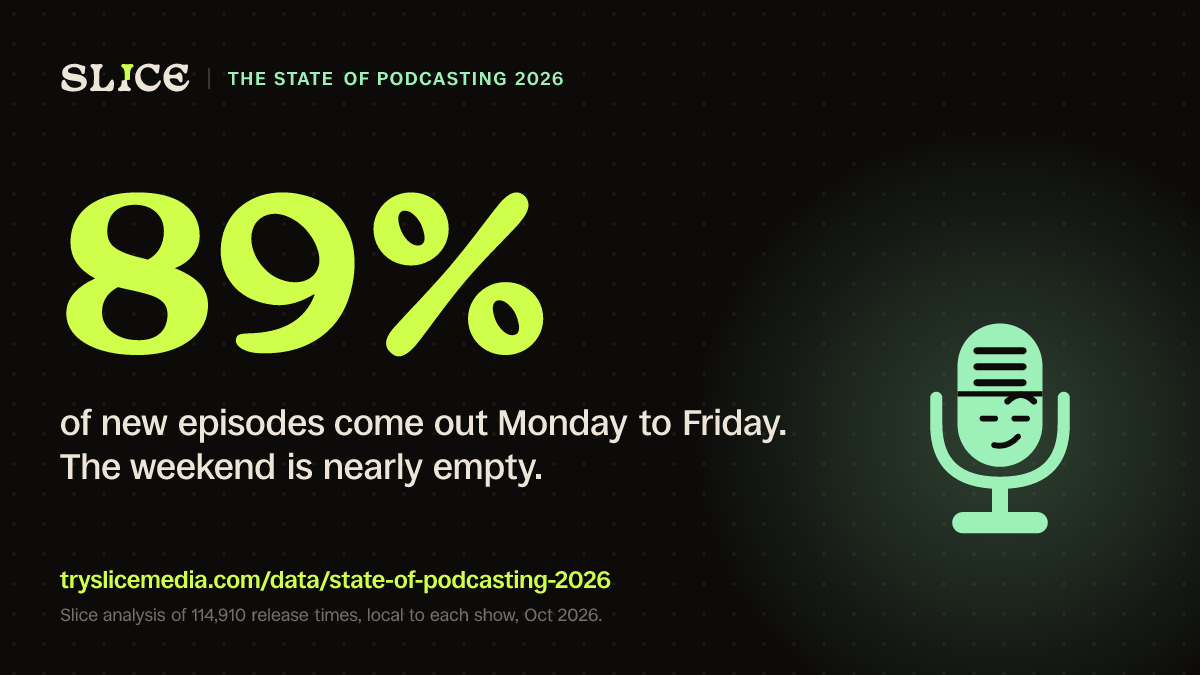
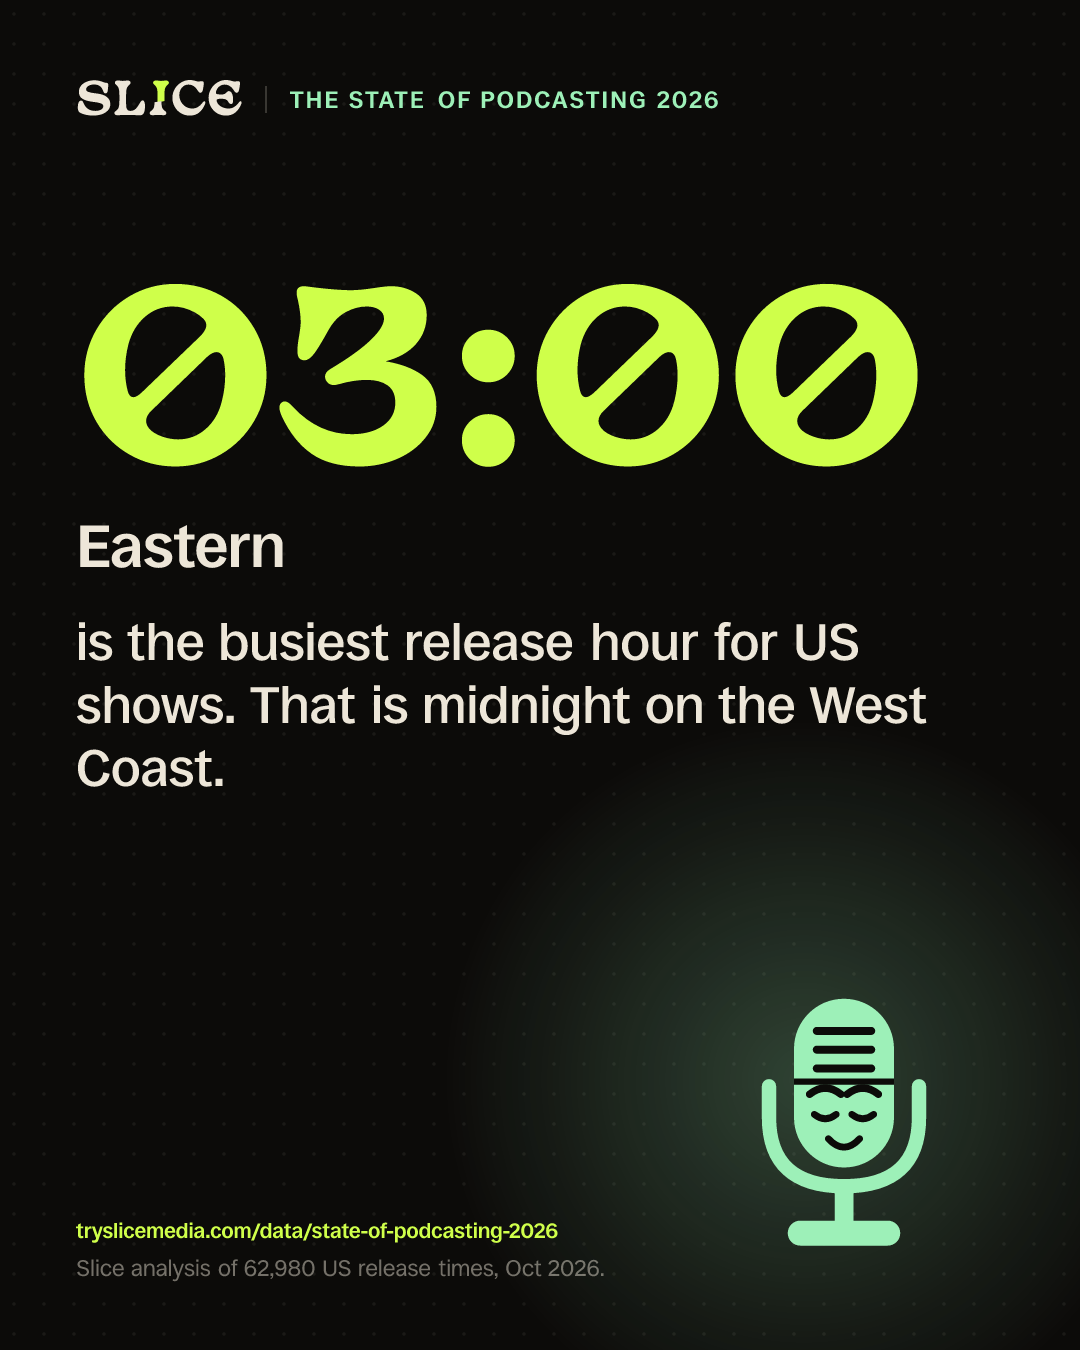
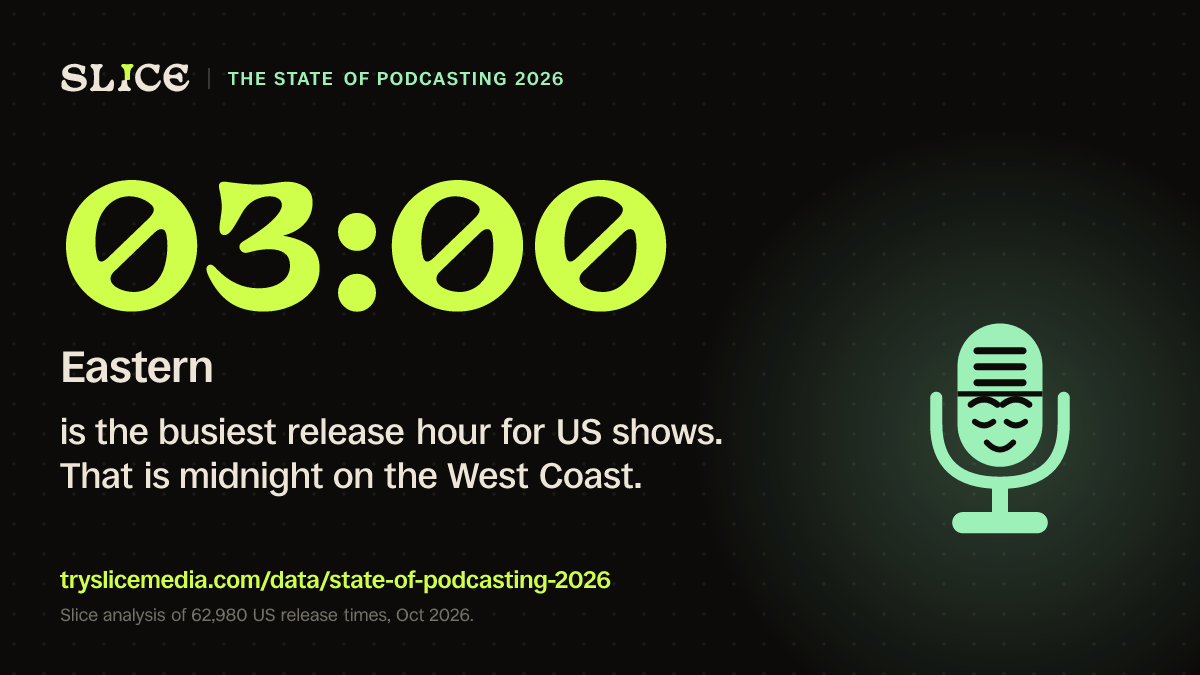
- 89% of episodes come out Monday to Friday and only 11% at the weekend (n = 114,910). For US shows the busiest hour is 03:00 Eastern, midnight on the West Coast, with 14% of releases (n = 62,980).
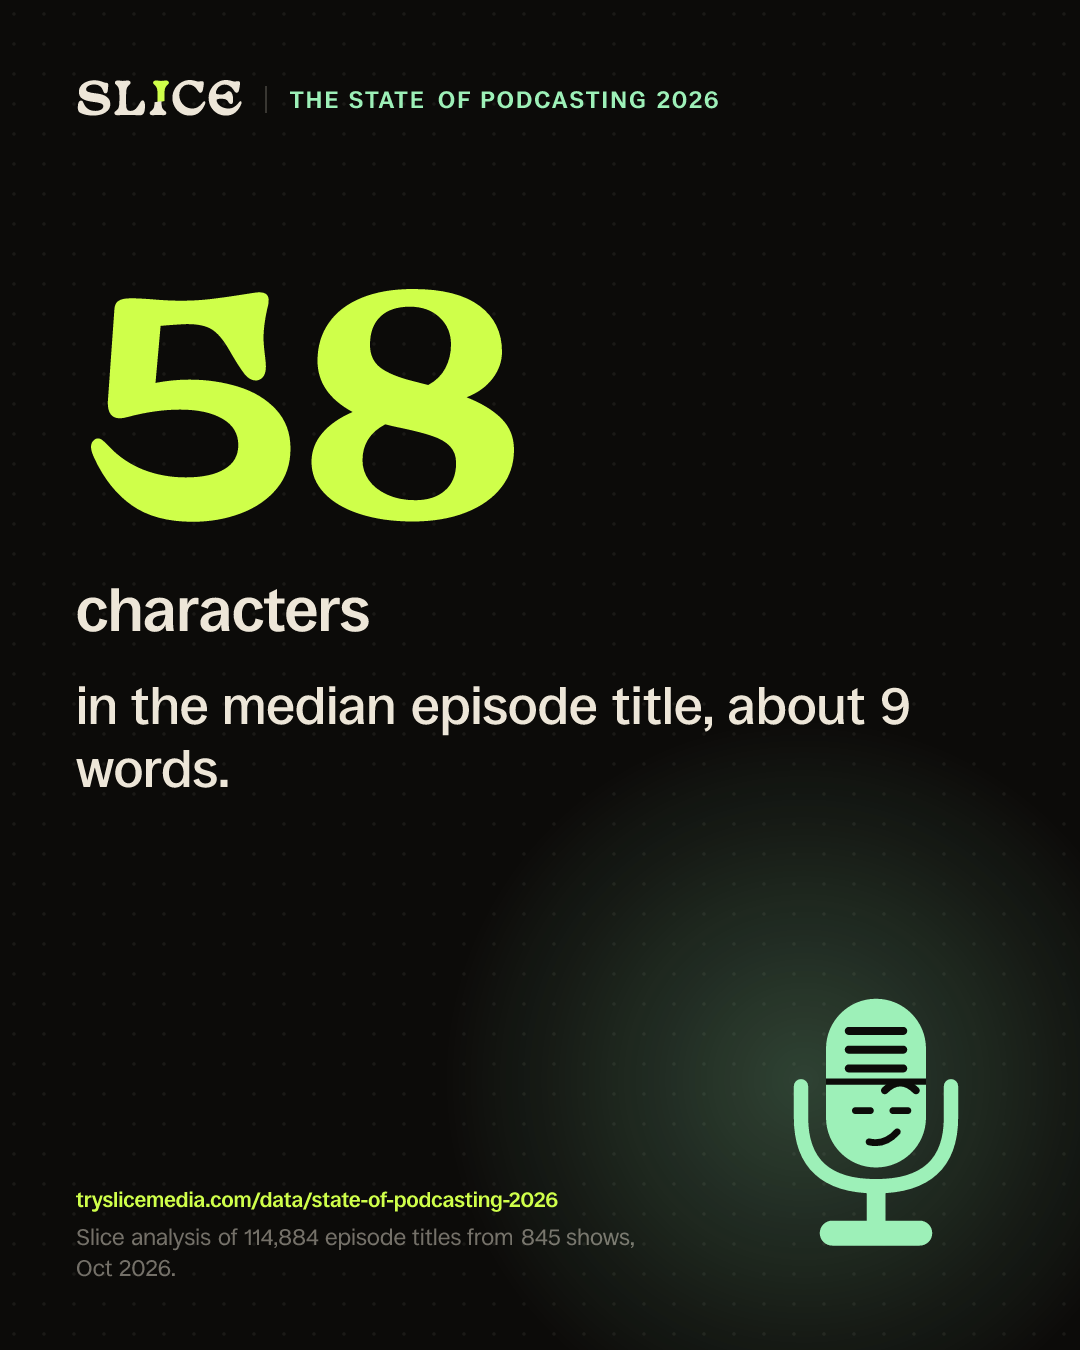
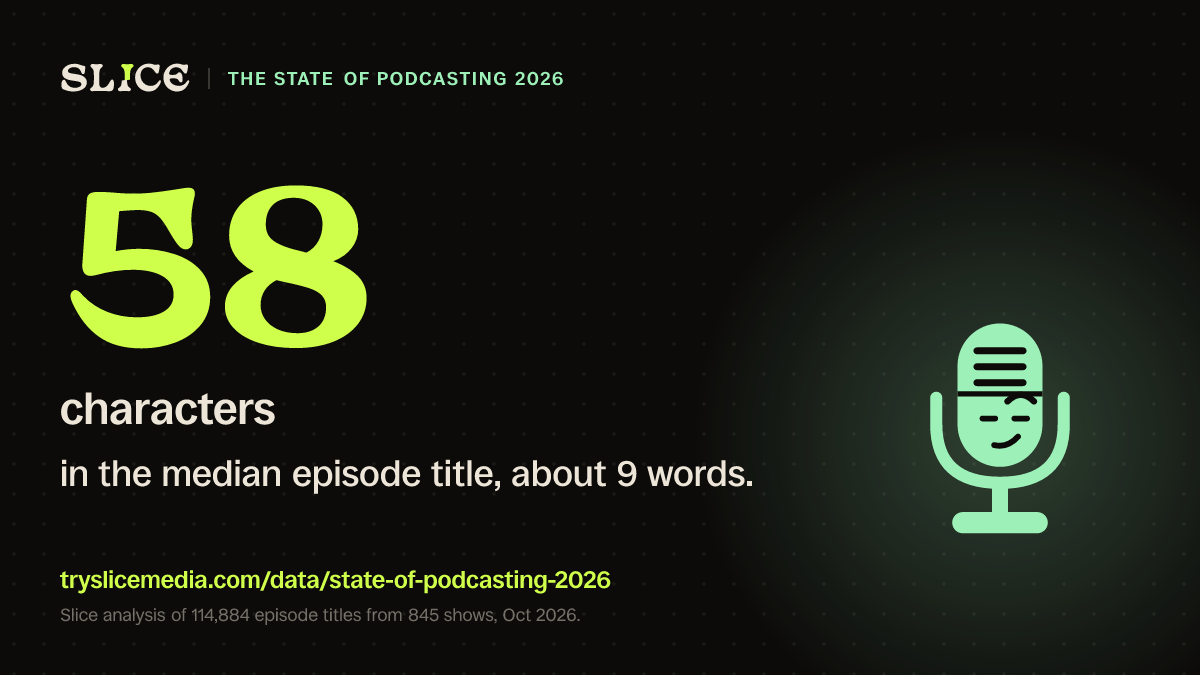
- The median episode title is 58 characters and 9 words; 12% are questions, 15% carry an episode number, and 0.6% use an emoji (n = 114,884 titles from 845 shows).
- The 327 shows that published every year since 2020 went from 4.4 to 8.6 episodes a month by 2026, and their typical episode from 52 minutes to 56 minutes.
Full episodes only; trailers and bonus episodes are counted separately. How we did it · Get the data
How does your show compare?
Pick your category, drag to your episode length and choose how often you publish. Mic will tell you where you sit among 881 top shows, and every chart below will mark you on it.
Short and sweet: 12 minutes less than the typical Society & Culture show (54 min). Your episodes are longer than 50% of top-chart episodes. 27% of top shows publish weekly, like you.
At that pace you record about 3.0 hours a month. That is a lot of clips waiting to be found.
How long is the average podcast episode in 2026?
The median full episode from a podcast in Apple's top charts runs 41.8 minutes, and the mean 47.8, across 114,770 episodes from 861 shows released between 2 October 2025 and 2 October 2026. Half of all episodes fall between 23 and 62 minutes. Because daily news shows publish so often and so short, the typical show is longer than the typical episode: the median of each show's own median is 49.9 minutes.
Every episode, ten minutes a column
Half of all episodes run under 42 minutes. Drag the line to see how many run longer than any length you pick.
27% of episodes run longer than 60 minutes.
Show the numbers
| Minutes | Episodes | Share |
|---|---|---|
| 0–10 | 10,981 | 9.6% |
| 10–20 | 13,843 | 12.1% |
| 20–30 | 15,741 | 13.7% |
| 30–40 | 13,027 | 11.4% |
| 40–50 | 17,241 | 15.0% |
| 50–60 | 13,298 | 11.6% |
| 60–70 | 9,292 | 8.1% |
| 70–80 | 5,525 | 4.8% |
| 80–90 | 3,601 | 3.1% |
| 90–100 | 2,571 | 2.2% |
| 100–110 | 2,164 | 1.9% |
| 110–120 | 1,567 | 1.4% |
| 120–130 | 1,962 | 1.7% |
| 130–140 | 1,081 | 0.9% |
| 140–150 | 757 | 0.7% |
| 150–160 | 479 | 0.4% |
| 160–170 | 340 | 0.3% |
| 170–180 | 304 | 0.3% |
| 180+ | 996 | 0.9% |
- 35%of episodes are under half an hour
- 38%run between 30 minutes and an hour
- 27%run past the hour
Percentiles: 10% of episodes are under 10 minutes, 90% are under 93. Trailers (954 in the feeds) have a median of 2.5 minutes and bonus episodes (5,677) 23 minutes; neither is in the figures above.
Which podcast categories have the longest episodes?
Comedy: the typical comedy show's median episode is 66 minutes (86 shows). Next come TV & Film (62 minutes, 51 shows) and Sports (57 minutes, 85 shows). News is the shortest of the large categories at 35 minutes (114 shows).
Typical length by category
Comedy runs longest; news is shortest. Tap two categories to compare them.
Compare
Tap a bar, or drag a category here.
With
Tap a bar, or drag a category here.
Show the numbers
| Category | Typical show (min) | Median episode (min) | Shows | Episodes |
|---|---|---|---|---|
| Comedy | 66.0 | 58.3 | 86 | 11,001 |
| TV & Film | 62.0 | 56.0 | 51 | 6,685 |
| Society & Culture | 54.1 | 54.1 | 94 | 6,879 |
| Health & Fitness | 52.9 | 52.8 | 62 | 5,002 |
| History | 48.3 | 50.1 | 22 | 1,541 |
| Sports | 56.9 | 49.7 | 85 | 21,587 |
| True Crime | 44.2 | 44.6 | 67 | 3,780 |
| Technology | 54.2 | 44.1 | 50 | 3,697 |
| Arts | 46.7 | 34.6 | 49 | 5,052 |
| Education | 36.8 | 29.7 | 62 | 5,232 |
| Business | 40.1 | 27.3 | 82 | 9,482 |
| News | 35.3 | 26.2 | 114 | 29,366 |
| Religion & Spirituality | 20.0 | 7.0 | 15 | 3,819 |
Categories are Apple’s, from each show’s primary genre; groups with fewer than 10 shows are left out.
Are podcast episodes longer in some countries?
Among the top 100 shows in each country's chart, the typical show's median episode ranges from 51 minutes in Canada to 44 minutes in India. Counting every episode instead, the gap is wider, because some charts lean on short daily shows.
Typical length by chart country
Canada’s top shows run longest, India’s shortest.
Show the numbers
| Country | Typical show (min) | Median episode (min) | Shows |
|---|---|---|---|
| United Kingdom | 50.9 | 45.1 | 100 |
| Canada | 51.0 | 41.4 | 99 |
| Australia | 47.8 | 41.2 | 100 |
| United States | 50.9 | 35.1 | 97 |
| India | 43.9 | 27.0 | 88 |
| Brazil | 49.2 | 25.7 | 96 |
Explore every show
One dot for each of the 881 shows. Group them by category, schedule or chart country, put length or output along the line, find a show, or draw a box over a cluster to sum it up.
861 shows in view, median 50 min. Mostly News (114), Society & Culture (94), Comedy (86).
Hover a dot for the show. Draw a box over dots to sum them up. Drag a row name up or down to put rows side by side.
Shorts by Slice
Turn your 42-minute episodes into clips.
The typical top show puts out about 6.2 hours of episodes a month. Shorts by Slice finds the moments that stand on their own and cuts them into captioned vertical clips for TikTok, Reels and Shorts.
Clip your next episodeHow often do top podcasts publish new episodes?
Weekly is the most common schedule (27% of 881 shows), then twice a week (17%), daily (15%) and three or four a week (14%). The median show that is still active publishes 7.2 episodes a month, measured over the six months to 2 October 2026.
How often top shows publish
Weekly is the most common schedule, but 15% of top shows publish every weekday.
Show the numbers
| Cadence | Shows | Share |
|---|---|---|
| Daily (5+ a week) | 136 | 15.4% |
| 3–4 a week | 124 | 14.1% |
| Twice a week | 152 | 17.3% |
| Weekly | 239 | 27.1% |
| Less than weekly | 92 | 10.4% |
| Irregular | 77 | 8.7% |
| Fewer than 3 in six months | 32 | 3.6% |
| New (under four weeks old) | 29 | 3.3% |
Episodes a month, by category
News shows publish the most: a median of 22 episodes a month.
Show the numbers
| Category | Episodes a month (median) | Daily shows | Shows |
|---|---|---|---|
| News | 21.6 | 48% | 111 |
| Religion & Spirituality | 20.9 | 47% | 15 |
| Sports | 14.2 | 36% | 81 |
| TV & Film | 8.7 | 19% | 47 |
| Comedy | 7.5 | 7% | 86 |
| Health & Fitness | 7.2 | 2% | 59 |
| History | 6.8 | 0% | 22 |
| Business | 6.2 | 14% | 81 |
| Education | 5.6 | 8% | 60 |
| Society & Culture | 5.0 | 5% | 85 |
| Arts | 4.5 | 13% | 47 |
| True Crime | 4.4 | 0% | 61 |
| Technology | 4.4 | 9% | 45 |
Cadence is read from full episodes in the six months to 2 October 2026. A show that started inside the six months is measured from its first episode, and one under four weeks old is not given a cadence. The episodes-a-month figures leave out both new shows and shows with fewer than three episodes in six months.
What day and time do podcasts release new episodes?
On weekdays: 89% of episodes come out Monday to Friday, with Thursday (19%) and Tuesday (18%) the busiest days and Sunday the quietest (5%). US shows most often release at 03:00 Eastern time, which is midnight Pacific. Times are read in each show's home market.
Release day
The working week, then a lull
Show the numbers
| Day | Episodes | Share |
|---|---|---|
| Mon | 20,783 | 18.1% |
| Tue | 21,108 | 18.4% |
| Wed | 19,405 | 16.9% |
| Thu | 22,273 | 19.4% |
| Fri | 18,866 | 16.4% |
| Sat | 6,829 | 5.9% |
| Sun | 5,646 | 4.9% |
89% of new episodes come out Monday to Friday.
Thursday is the busiest day; Sunday the quietest, with 4.9%.
By the hour, in each show’s home market, the mornings light up.
Hover any square for its share of the week’s releases.
US shows cluster at 03:00 Eastern: midnight on the West Coast, so the episode is waiting when the country wakes up.
In UTC, the same releases spread across the day: the clock you publish on depends on who you publish for.
| Home market | Busiest hours, local | Weekdays | Shows |
|---|---|---|---|
| United States | 03:00 (14%), 12:00 (8%), 06:00 (7%) | 89% | 480 |
| Canada | 00:00 (13%), 05:00 (11%), 04:00 (11%) | 88% | 78 |
| United Kingdom | 00:00 (15%), 01:00 (8%), 16:00 (8%) | 92% | 85 |
| Australia | 05:00 (18%), 11:00 (9%), 04:00 (8%) | 92% | 61 |
| India | 06:00 (10%), 18:00 (9%), 05:00 (9%) | 84% | 83 |
| Brazil | 05:00 (10%), 01:00 (10%), 18:00 (9%) | 89% | 94 |
Each show’s times are read in its home market, the country whose overall chart ranks it highest (US for shows only in a US category chart), using one zone per country: New York, Toronto, London, Sydney, Kolkata and São Paulo, daylight saving included. 1,695 episodes stamped exactly 00:00 are left out of the hours, because many feeds use midnight to mean “no time given”; they still count for the day.
How long should a podcast episode title be?
Top shows' titles have a median of 58 characters and 9 words; half are between 40 and 81 characters, and 35% run past 70. 28% use a colon to split the title and 16% a vertical bar.
What goes in a title
The median title is 58 characters. Colons and guest names are common; emoji are rare.
Show the numbers
| Feature | Share of episodes | Averaged across shows |
|---|---|---|
| A number (not the episode number) | 32.7% | 24% |
| A colon | 28.2% | 26.9% |
| A word in capitals | 16.8% | 12.5% |
| A vertical bar “|” | 16.4% | 16.8% |
| An episode number | 15.4% | 24.1% |
| A question | 11.5% | 10.3% |
| A guest (“with”, “ft.”) | 6.8% | 8.5% |
| An emoji | 0.6% | 0.6% |
Are podcasts getting longer?
For the same shows, slightly, and they publish far more often, though these are the shows that survived to chart today. The 327 current chart shows that released at least four episodes in every year from 2020 went from a typical 52 minutes to 56 minutes an episode, and from 4.4 to 8.6 episodes a month. Across all of today's chart shows, the median episode fell from 47 minutes in 2020 to 42 minutes in 2026, which suggests the newer shows in the charts are shorter, not that established shows have cut back.
2020 to now
Today’s top shows have kept their length
Same 327 showsAll of today’s shows
Show the numbers
| Year | Same shows: typical minutes | All of today’s shows: median minutes |
|---|---|---|
| 2020 | 51.6 | 47.4 |
| 2021 | 53.9 | 48.5 |
| 2022 | 54.0 | 47.1 |
| 2023 | 54.6 | 46.2 |
| 2024 | 56.4 | 44.5 |
| 2025 | 57.5 | 43.6 |
| 2026 | 55.7 | 41.5 |
The same-shows panel is every show with at least four full episodes in each year from 2020. Some feeds hold only their most recent episodes; 368 of 881 reach back to 2020.
What this means if you clip your podcast
A top show that is still publishing puts out a median of 6.2 hours of new episodes a month, and a quarter of them more than 11.9 hours. 27% of episodes run past an hour.
For anyone making short clips, that length is the raw material: a long conversation has more stories and more moments that stand on their own than a short one. A weekly show at the typical length gives you roughly 4 hours a month to choose from. If you would rather not scrub through it yourself, Shorts by Slice finds the moments in a long episode and cuts them into vertical clips with captions; to see which three moments in an episode are worth it first, try the free podcast clip finder. Everything else we make for podcasters is on one page.
Look up a show
Every show in the study, with its median episode length over the last 12 months and how often it published over the last six. Search, filter, sort by any column, and tap a show to pin it on the length chart and the dots.
881 of 881 shows
| TV & Film · US TV & Film #44 | 62 min | — | New |
|---|---|---|---|
| Society & Culture · AU Top #57 | 44 min | — | New |
| News · US News #38 | 14 min | 18.6 | 3–4 a week |
| Education · US Education #34 | 11 min | 2.5 | Less than weekly |
| True Crime · US True Crime #31 | 62 min | 4.3 | Weekly |
| Health & Fitness · US Health & Fitness #27 | 67 min | 12.5 | 3–4 a week |
| Comedy · US Comedy #44 | 73 min | 2.7 | Less than weekly |
| Education · IN Top #35 | 27 min | 4.3 | Weekly |
| True Crime · US True Crime #10; CA Top #25; US Top #64 | 43 min | 16.7 | 3–4 a week |
| Sports · US Sports #46 | 53 min | — | New |
| Business · US Business #12; US Top #38 | 20 min | 4.3 | Weekly |
| News · IN Top #11 | 19 min | 45.1 | Daily |
| Sports · CA Top #12; US Sports #48 | 94 min | 7.2 | Irregular |
| True Crime · US True Crime #5; CA Top #10; US Top #27; AU Top #47 | 40 min | 20.1 | 3–4 a week |
| Education · BR Top #16; US Education #32; IN Top #77 | 7 min | 4.3 | Weekly |
| News · AU Top #42 | 16 min | 32.4 | Daily |
| Arts · US Arts #6 | 36 min | 4.0 | Weekly |
| Leisure · BR Top #92 | 96 min | 4.5 | Weekly |
| Technology · US Technology #46 | 7 min | 21.1 | 3–4 a week |
| Business · US Business #34 | 57 min | 4.3 | Weekly |
| News · BR Top #18 | 68 min | 4.3 | Weekly |
| Business · AU Top #69 | 23 min | 27.1 | Daily |
| News · AU Top #17 | 16 min | 21.7 | Daily |
| History · AU Top #16 | 29 min | 5.3 | Weekly |
| Technology · US Technology #39 | 126 min | 4.3 | Weekly |
| Technology · US Technology #4; IN Top #28; CA Top #98 | 236 min | 0.8 | Less than weekly |
| Comedy · US Comedy #13 | 108 min | 30.4 | Daily |
| Sports · AU Top #9 | 11 min | 26.4 | Daily |
| History · GB Top #75 | 49 min | 8.9 | Twice a week |
| Technology · US Technology #2 | 38 min | 1.8 | Irregular |
| Kids & Family · IN Top #76 | — | 0.0 | Rarely / paused |
| Education · US Education #29; BR Top #67 | 19 min | 22.4 | Daily |
| News · US News #32 | 42 min | 18.9 | 3–4 a week |
| Sports · US Sports #39 | 60 min | 9.9 | Twice a week |
| Society & Culture · US Society & Culture #33 | 36 min | 2.7 | Less than weekly |
| Technology · US Technology #3; IN Top #68 | 66 min | 11.4 | 3–4 a week |
| Comedy · AU Top #79 | 101 min | 11.2 | 3–4 a week |
| Technology · US Technology #19 | 171 min | 4.5 | Weekly |
| Education · BR Top #95 | 29 min | 2.8 | Less than weekly |
| True Crime · US True Crime #39 | 55 min | 0.5 | Less than weekly |
| News · GB Top #59 | 31 min | 13.9 | 3–4 a week |
| Business · US Business #42 | 38 min | 3.5 | Weekly |
| News · BR Top #96 | 103 min | 4.3 | Weekly |
| News · IN Top #24 | 82 min | 8.7 | Twice a week |
| Society & Culture · GB Top #87 | 110 min | 5.7 | Weekly |
| Society & Culture · BR Top #46 | 29 min | 0.2 | Rarely / paused |
| Comedy · US Comedy #29 | 68 min | 8.7 | Twice a week |
| Comedy · US Comedy #5; CA Top #19; US Top #55 | 110 min | 13.0 | 3–4 a week |
| News · US News #37 | 36 min | 115.2 | Daily |
| Arts · US Arts #34 | 37 min | 1.7 | Less than weekly |
How we did it
Which shows
Every show in Apple Podcasts’ top 100 for the United States, United Kingdom, Canada, Australia, India and Brazil, plus the US top 50 in eleven categories (Arts, Business, Comedy, Education, Health & Fitness, News, Society & Culture, Sports, Technology, True Crime, TV & Film), read on 2 October 2026. That is 17 charts and 887 unique shows once duplicates across charts are merged; each show keeps a record of every chart and rank it appeared at, which is in the download. The overall charts for United States and United Kingdom came from Apple’s Marketing Tools RSS API. For Canada, Australia, India and Brazil that API timed out or returned an error, so we used Apple’s older iTunes RSS chart; when we compared the two on 2 October 2026 they returned the identical US top 100 in the identical order. The category charts are only available from the iTunes RSS chart. Each show’s feed address and primary genre come from the iTunes Lookup API, and sub-genres are rolled up to their parent using Apple’s genre list.
The feeds
Each public feed was fetched once on 2 October 2026, at no more than three requests a second, with a User-Agent naming this page. 881 feeds answered; 6 shows are missing (3 had no public feed address, 3 returned an error or timed out), and we did not retry around a refusal. No audio was downloaded. From each episode we read the title, publication date, itunes:duration, enclosure size and type, episode type, explicit flag and season and episode numbers. Descriptions were not kept.
Cleaning
- Which episodes. Length, title and timing figures use full episodes released in the 12 months from 2 October 2025 to 2 October 2026 (114,910 episodes). Episodes marked
trailer(954) orbonus(5,677) are reported separately; an episode with no type counts as full, which is Apple’s default. - Durations. Read from
itunes:durationin seconds, MM:SS or HH:MM:SS (minutes above 59 accepted, fractions rounded). 115 episodes had no readable duration and 25 fell outside one minute to twelve hours; both are left out of length figures rather than guessed. - Duplicates. An episode repeated in the same feed (same guid) counts once (87 dropped). A show in several charts counts once.
- Outliers. We report medians and percentiles rather than averages, so a few four-hour episodes do not move the headline. Groups of fewer than 10 shows are not shown.
- Dates. Publication dates are converted to the show’s home-market time zone (see above); scheduled episodes dated in the future would be dropped (there were none).
- Cadence. Episodes per week over the six months to 2 October 2026: daily is 5 or more, three to four a week is 2.5 to 5, twice a week 1.5 to 2.5, weekly 0.75 to 1.5. Episodes released within the same minute count as one release. Shows with fewer than three episodes in six months are their own group, a show that started inside the six months is measured from its first episode, and one under four weeks old is labelled new.
Limitations
- Top-chart bias. These are the most popular shows on Apple Podcasts. Independent and new podcasts may look quite different.
- Survivorship. The 2020–2026 trends are today’s chart shows looked at backwards, not a sample of podcasts that existed in 2020.
- RSS durations are self-reported. We checked them against file size: for 83,615 audio episodes with both, 0.3% implied a bitrate outside 16–400 kbps, suggesting a wrong duration. Dynamically inserted adverts can also make the real file longer than the stated duration.
- Release times are the feed’s. Some hosts stamp the time the episode was scheduled or uploaded, not when it went live.
- Chart day. Apple’s charts move daily; this is one day’s snapshot.
Spot checks
After the run we re-fetched ten feeds by hand (The Daily, Crime Junkie, Up First, The Rest Is History, The Joe Rogan Experience, Unravel, Global News Podcast, Não Inviabilize, Tomorrow, Today and Pardon My Take) and compared the three latest episodes in each, read with a separate parser, against our dataset. All 30 durations and dates matched.
Attribution and terms
Chart positions are from Apple’s public Apple Podcasts chart feeds; episode data is from each show’s own public RSS feed, and the shows and their publishers own their titles and content. We used only publicly published feeds and Apple’s public chart APIs, did not scrape any website, and publish only aggregate statistics and per-show summaries. Slice is not affiliated with, or endorsed by, Apple or any show listed here.
How to cite
The data is free to reuse under CC BY 4.0, with credit to Slice:
Slice. “The State of Podcasting 2026.” Data fetched 2 October 2026. https://tryslicemedia.com/data/state-of-podcasting-2026
We plan to run the study again every month. Questions or corrections: mediabyslice@gmail.com.
Get The Cut
Download the data
Free · CSV and JSON · 3 files
Every show in the study with its median length and cadence, and every table on this page in long format. Two CSVs.
- Every show (CSV) One row per show in the study: charts and ranks, home market, episodes, median length and percentiles, cadence.
- Every table (CSV) Every table on the page in long format: one number per row, with what it is and its n.
- All the aggregates (JSON) The whole dataset behind the page: every breakdown, histogram, heatmap and trend.
Free to reuse under CC BY 4.0: credit “Slice (tryslicemedia.com)” and link to this page. Leave the box unticked and we send you nothing. Everything on this page stays free to read without an email.
Made by Shorts by Slice. The typical top show puts out about 6.2 hours of episodes a month. Shorts by Slice finds the moments that stand on their own and cuts them into captioned vertical clips for TikTok, Reels and Shorts.
Clip your next episodeMore research from Slice
- What creative jobs pay in 2026Salaries and freelance rates for editors, designers, writers and podcasters, every figure sourced.
- Social video specs 2026Sizes, lengths, file limits and measured safe zones for twelve formats, each with its source.
- We checked the cover art of 1,000 top podcastsSizes, formats, colours and text, measured with our cover art checker.
- How many creatives work for themselves?US Census, BLS and UK figures on self-employed artists, writers, photographers and filmmakers.
- Creator economy statistics 2026The most-cited figures, each with its source, its date and the range where sources disagree.
- The Podcast Census 2026Every podcast in the open Podcast Index, counted: how many are alive, where they quit, video, automation and names.